Plot P/Z
Fig. 20 shows a typical view of the P/Z tab for plotting poles and zeros, here, an elliptical filter (IIR) is shown.
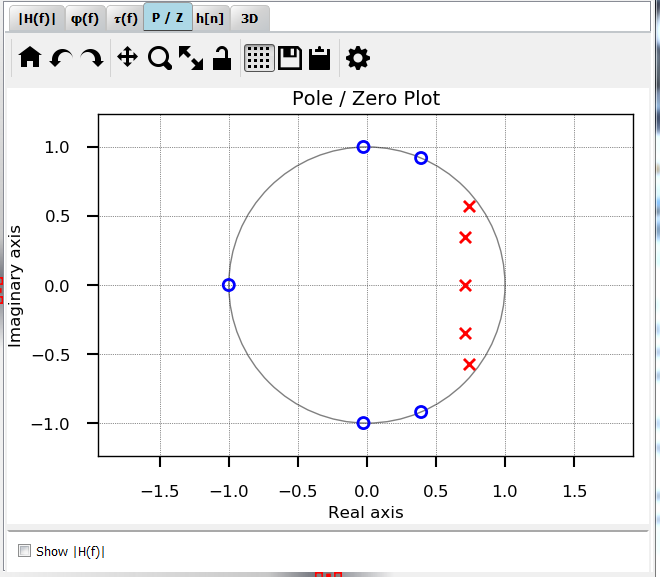
Fig. 20 Screenshot of the P/Z tab
Optionally, the magnitude frequency response can be plotted around the unit circle to show the influence of poles and zeros (Fig. 21).
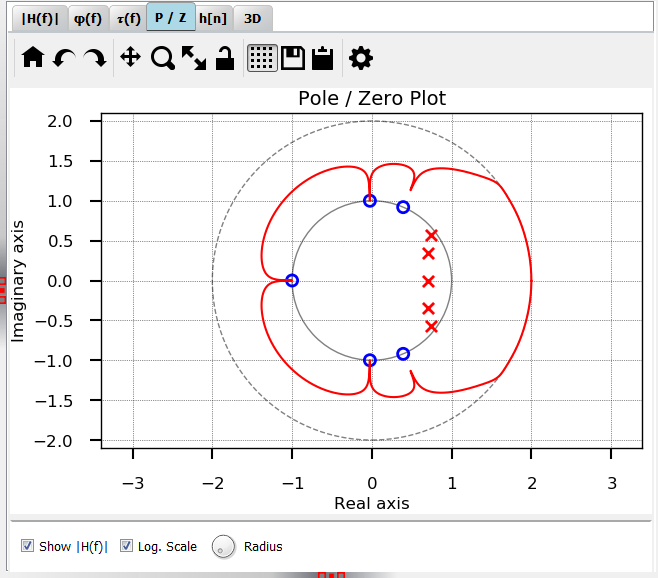
Fig. 21 Screenshot of the P/Z tab with overlayed H(f) plot