Plot tau(f)
Fig. 19 shows a typical view of the \(\pmb{\tau(f)}\) tab for plotting the group delay, here, an elliptical filter (IIR) is shown.
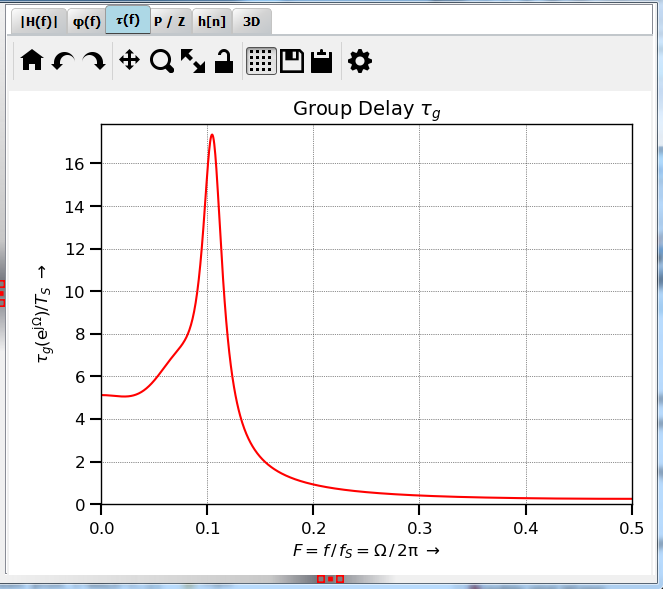
Fig. 19 Screenshot of the \(\tau(f)\) tab
There are no user servicable parts on this tab.
Development
More info on this widget can be found under plot_tau_g.