Plot Phi(f)
Fig. 17 shows a typical view of the \(\pmb{\varphi(f)}\) tab for plotting the phase response of an elliptical filter (IIR).
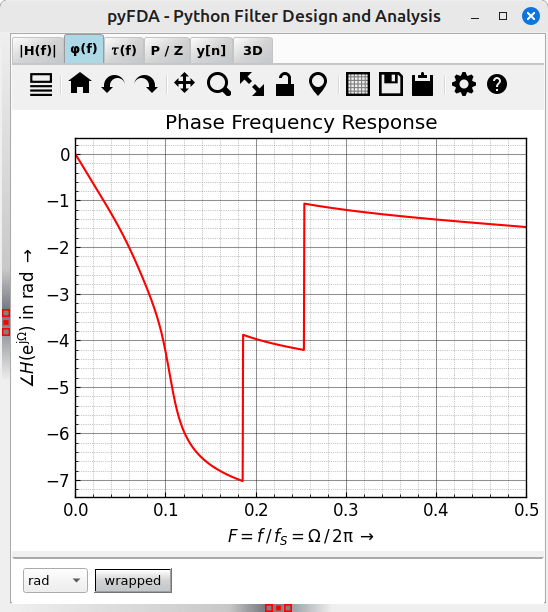
Fig. 17 Screenshot of the \(\varphi(f)\) tab
You can select the unit for the phase and whether the phase will be wrapped between \(-\pi \ldots \pi\) or not.
Development
More info on this widget can be found under plot_phi.